
The History page is your complete trade journal. Every position that has ever closed — winner or loser, automated or manual — lives here.
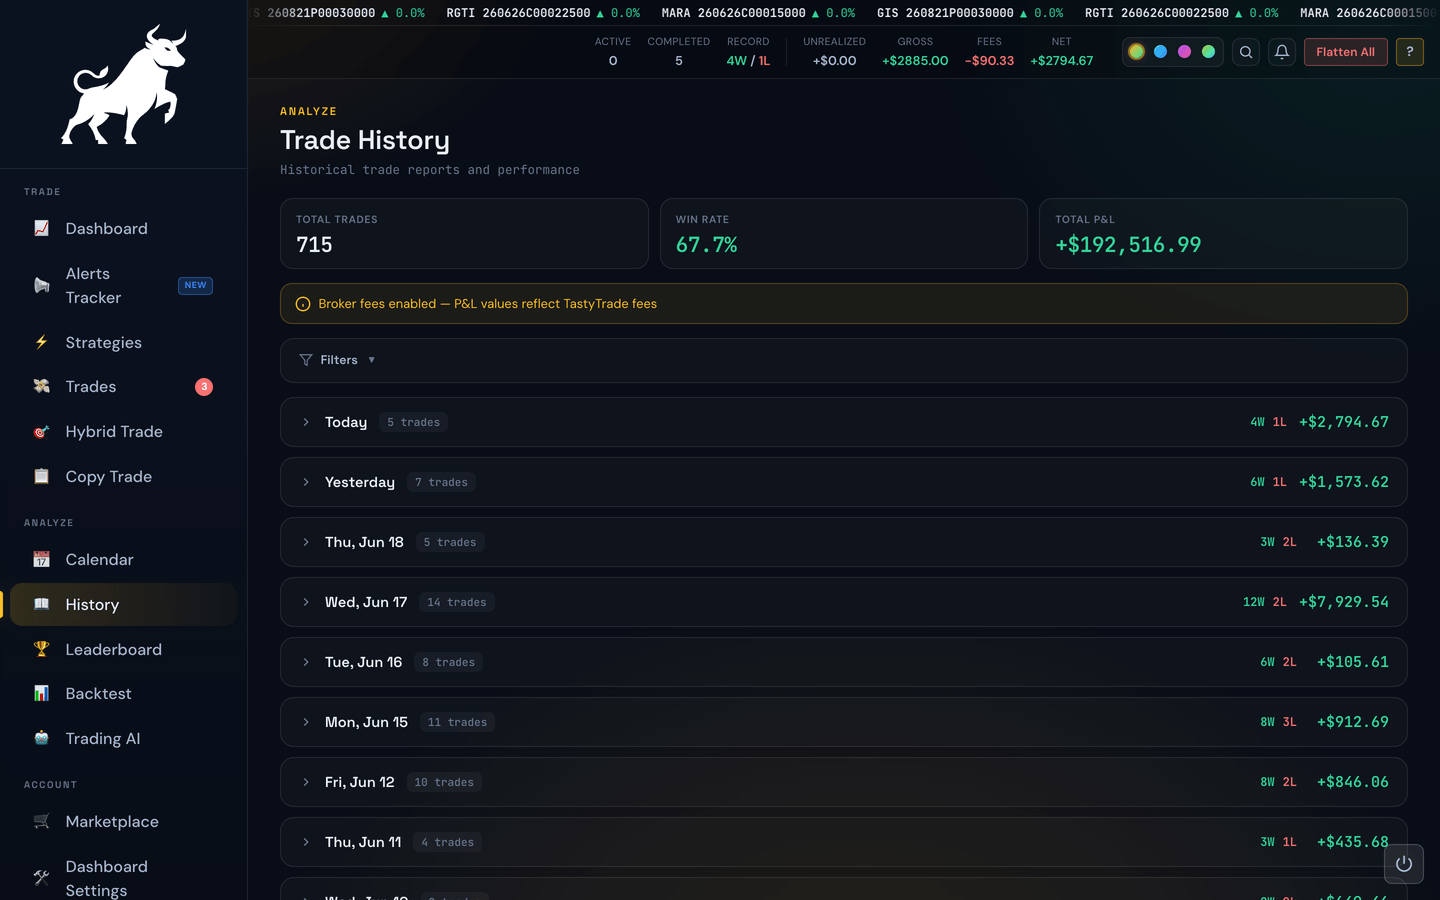
What you see
Trades are grouped by date, newest first. Each row shows you:
- The ticker, direction, and strike (e.g. SPY 450 Call).
- Entry and exit prices.
- Quantity of contracts.
- Result — win, loss, or break-even.
- Profit/Loss in dollars and percent.
- Exit reason — profit target hit, stop-loss hit, time limit, or closed manually.
- Source — whether the trade came from an automated alert or you placed it by hand.
The summary header
At the top of the page is a quick summary of the trades currently visible: total trades, win rate, total profit, and total fees. Whenever you change a filter, this summary updates with it.
Filtering
The filter panel collapses by default. Click Filters to expand it; if any filters are already active you'll see a count badge on that button. Clear All resets every filter at once.
Inside the panel you can narrow your history by:
- Date range — From and To inputs. Pick a precise window when "Month" or "Year" isn't specific enough.
- Strategy — chips you click to include or exclude each strategy. Multi-select.
- Signal source — chips for each alert source (Dope Spreads, Signal-Hub, marketplace subscriptions, etc.). Multi-select.
- Outcome — Wins, Losses, Breakevens. Pick any combination.
Filters stack — applying more than one narrows the list to trades that match all of them.
Example
To answer "How have my Signal-Hub trades done this month, ignoring break-evens?", set the date range to the first of the month through today, click the Signal-Hub source chip, and click both the Wins and Losses outcome chips.
How the list is grouped
Trades are grouped into per-day accordions, newest day at the top. The header of each day shows the date, the trade count, a wins/losses/break-evens summary, and the day's total P&L (green or red). Click a day's header to expand its trades; click again to collapse. This makes it easy to scan months of history without drowning in rows.
Fees and Net columns
If you've enabled broker fees in Dashboard Settings, the table grows two extra columns: Fees (what your broker took for each trade) and Net (gross P&L minus fees). Turn the toggle off and the columns disappear. See the Fees & Slippage topic for the full story on how fees are calculated.
Drilling into a trade
Clicking a row expands it to show the full lifecycle of that trade: when it opened, the highest and lowest prices it reached, the trailing-stop path (if any), the exact exit, and the fees charged on the way in and out. For spread trades you'll also see the per-leg breakdown — same as the Trades page.
Exporting to CSV
The Export CSV button at the top of the page downloads your trade history as a spreadsheet file (.csv) that opens in Excel, Google Sheets, or Numbers.
It exports exactly the trades you're currently looking at — whatever's left after your filters and the Live/Paper toggle. So if you filter to your OG strategy for last week and click Export CSV, the file contains just those trades, in the same order they appear on screen.
Each row includes the date, entry and exit times, ticker, broker, strategy, how the trade started (Alert, Manual, or Copy), quantity, entry and exit prices, percent return, gross P&L, fees, net P&L, the result (Win / Loss / BE), the exit type, any scale-in and multi-leg exit detail, and whether the trade was broker-verified.
Note
If a trade was reconciled with your broker (a green ✓ Verified), the file uses the broker-verified entry and exit prices — the real fills — not the originally-reported ones. The Fees and Net columns follow your Broker fees toggle in Dashboard Settings: turn fees on to see them filled in.
Tip
Use the filters first to narrow things down, then export — it's the fastest way to pull, say, a single month or a single strategy into your own trading journal or a tax spreadsheet.