
The Marketplace is where you browse and subscribe to additional alert sources. Each listing in the marketplace is a strategy run by someone else (or by us) that publishes trade ideas you can plug into your own bot.
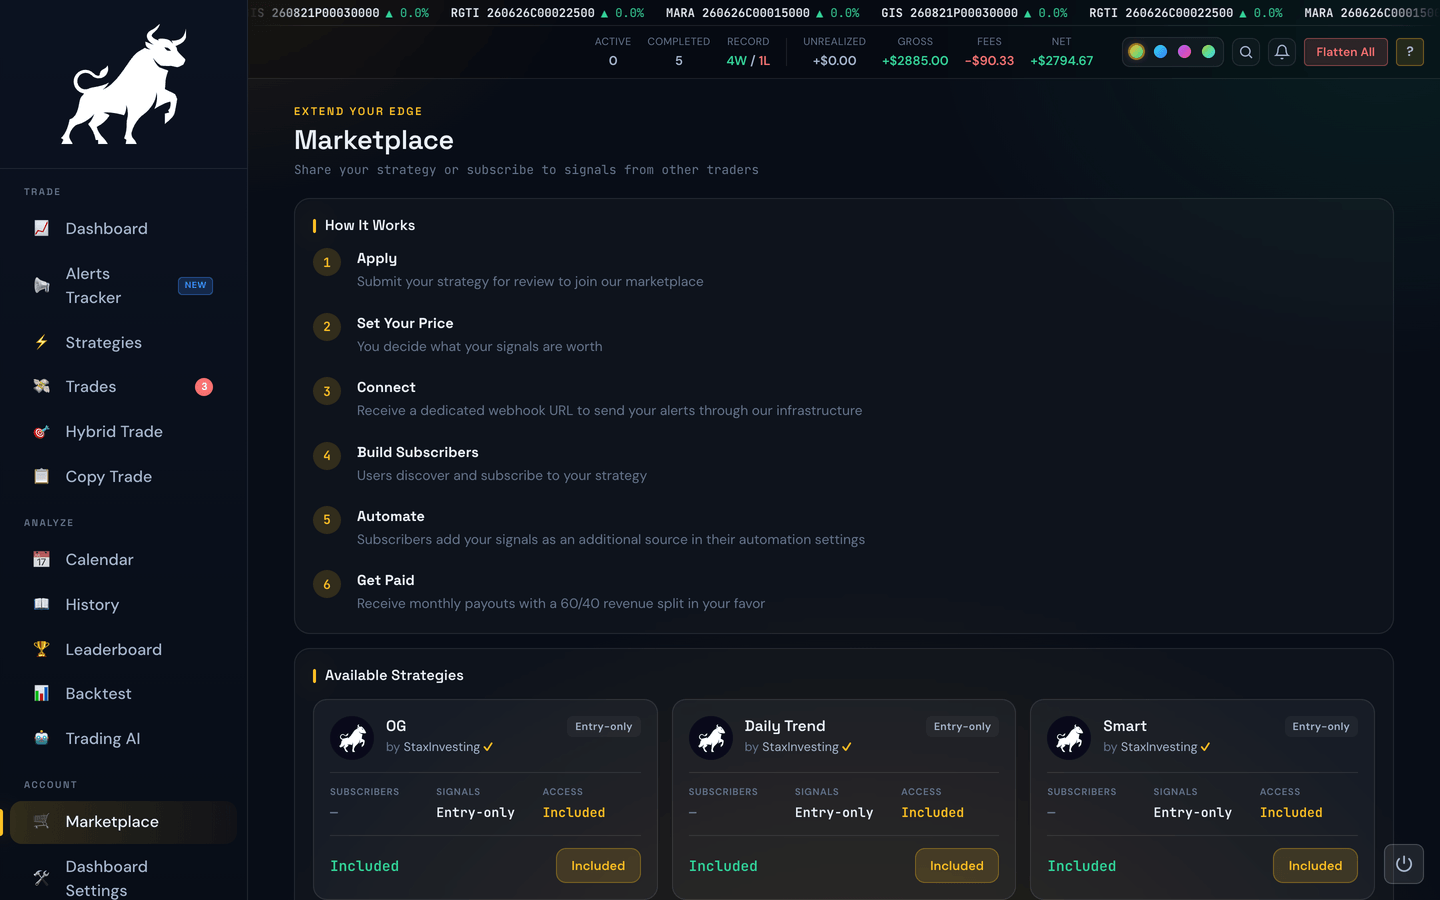
Browsing
The marketplace shows each available strategy with a short description and stats so you can decide whether to subscribe. You're not committing to anything until you click subscribe.
Subscribing
Clicking Subscribe asks you to confirm. After you confirm, that strategy becomes available as an alert source the next time you open the Strategies (or Trading Settings) page — you can then point one of your bots at it.
Unsubscribing
If you decide a strategy isn't for you, find it in the marketplace and click Unsubscribe. The strategy stops sending you alerts after the next refresh.
What subscribing does (and doesn't do)
- It does make the strategy's alerts available to your bot.
- It does not automatically start trading them — you still have to attach the source to one of your strategies and turn that strategy on.
- It does not charge you extra (unless the listing itself is a paid subscription, in which case the listing will tell you so up front).
Tip
A new subscription is a great candidate for a backtest before you flip it on live. Subscribe, run a backtest against its historical alerts, and let the past results inform your decision.
If you publish a strategy of your own
Any listing you own is tagged YOURS in the marketplace and carries an Edit button, so you can change its name, description, and price yourself. See Managing Your Strategy Listing.
Opening a strategy detail page
Click any strategy in the marketplace list to open its detail page. This is where you research a strategy in depth before subscribing — and revisit it after you've subscribed to keep tabs on how it's been doing.
The detail page is built around three areas:
Stats cards at the top summarize the strategy's track record:
- Win Rate — percentage of historical alerts that closed profitably.
- Total P&L — running total over the period the page is showing.
- Profit Factor — dollars made per dollar lost.
- Avg Win and Avg Loss — typical size of a winner and a loser.
- Best Trade and Worst Trade.
- Win Streak and Loss Streak — longest consecutive runs.
- Total Trades — how many alerts the strategy has published.

Equity curve — a chart of the strategy's cumulative P&L over time. The curve reacts to the inputs described below, so the same strategy can look different depending on how you would have traded it.
Trade history — every alert the strategy has ever published, split into two sections:
- Open Positions — alerts that haven't closed yet, with live prices, session high/low, and a running P&L %.
- Historical — the full closed-trade log with entry, exit, days-to-expiration (DTE), and an outcome pill.
Click any spread-type pill to expand a row and see the per-leg breakdown — same convention as the rest of the portal.
Paper-traded history
A few strategies were forward-tested on a paper trading account before their author started trading them with real money, and that early stretch is included in the track record so you can see the whole story. Those trades are tagged with a pink PAPER pill next to their WIN or LOSS, and a note above the stats cards tells you how many there are and the date real-money trading began.
The signals and the option prices in a paper stretch are real — what's missing is a real broker filling the order. In live trading you can get a slightly worse price than the one you saw, so treat a paper-heavy record as a promising sign rather than a finished one, and give more weight to the trades taken after the author went live.
Example
A strategy shows 26 trades. The banner reads "21 of the 26 trades below are marked PAPER… Live broker execution began Jul 20, 2026." That tells you the last handful of trades are the real-money ones — worth scrolling to before you subscribe.
Strategies that sell options (credit strategies)
Some strategies make money by selling options instead of buying them — think credit spreads, iron condors, or selling a call or put outright. For these, the trader collects money up front (the credit) and profits by buying the position back for less than they collected.
That flips what "good" looks like on the price: the price going DOWN is the win. The detail page knows this and scores every trade from the seller's side, so the P&L, win/loss pills, and best/worst numbers always reflect what the strategy actually made.
Example
A strategy sells a SOFI call for $0.40 and later buys it back for $0.07. The option's price fell — and that's a win of $33 per contract, because the seller kept most of the $40 credit they collected up front.
Max Capital Per Trade
The Max Capital Per Trade input controls how much money the detail page assumes you'd have committed to each alert. Every number on the page — stats cards, equity curve, P&L percentages — recalculates instantly when you change it. The setting is remembered separately for each strategy, so a $5,000 sizing on one strategy and a $500 sizing on another won't step on each other.
Example
A strategy's historical equity curve looks great at $1,000 per trade. Bump it to $5,000 and you'll see how that same track record would have played out with more capital behind every alert — bigger wins, bigger losses, and a bigger drawdown line.
Min Win % Threshold (entry-only sources)
Some strategies publish entry-only alerts — meaning the alert says "buy this" but never publishes a corresponding exit. For these strategies the detail page can't always tell whether an old alert was a winner or a loser. That's where the Min Win % input comes in: you tell the page the minimum profit a trade had to reach to count as a win. Anything that hit that bar is a WIN; anything that didn't is a LOSS; alerts that haven't fully played out yet are POTENTIAL. See the Signal Sources topic for more on entry-only vs entry+exit.
The MAX badge and POTENTIAL pill
On entry-only strategies you'll see two extra markings:
- A MAX badge on a row's P&L means the number shown is the best the trade ever reached (the session high), not necessarily what you would have walked away with. It's a "best-case" reference point.
- A POTENTIAL outcome pill marks trades that haven't met your Min Win % threshold or your equivalent of a final answer — they're still open-ended.
Live versus static sources
A strategy that's currently live (still publishing alerts) shows real-time prices on its Open Positions. A strategy that's been retired or paused still shows its historical record, but no live updates.
Tip
The detail page is the right place to kick the tires before you subscribe. Look at the equity curve at your preferred sizing, scroll the historical trade list to spot streaks of losses, and decide whether that pattern is something you could sit through.