
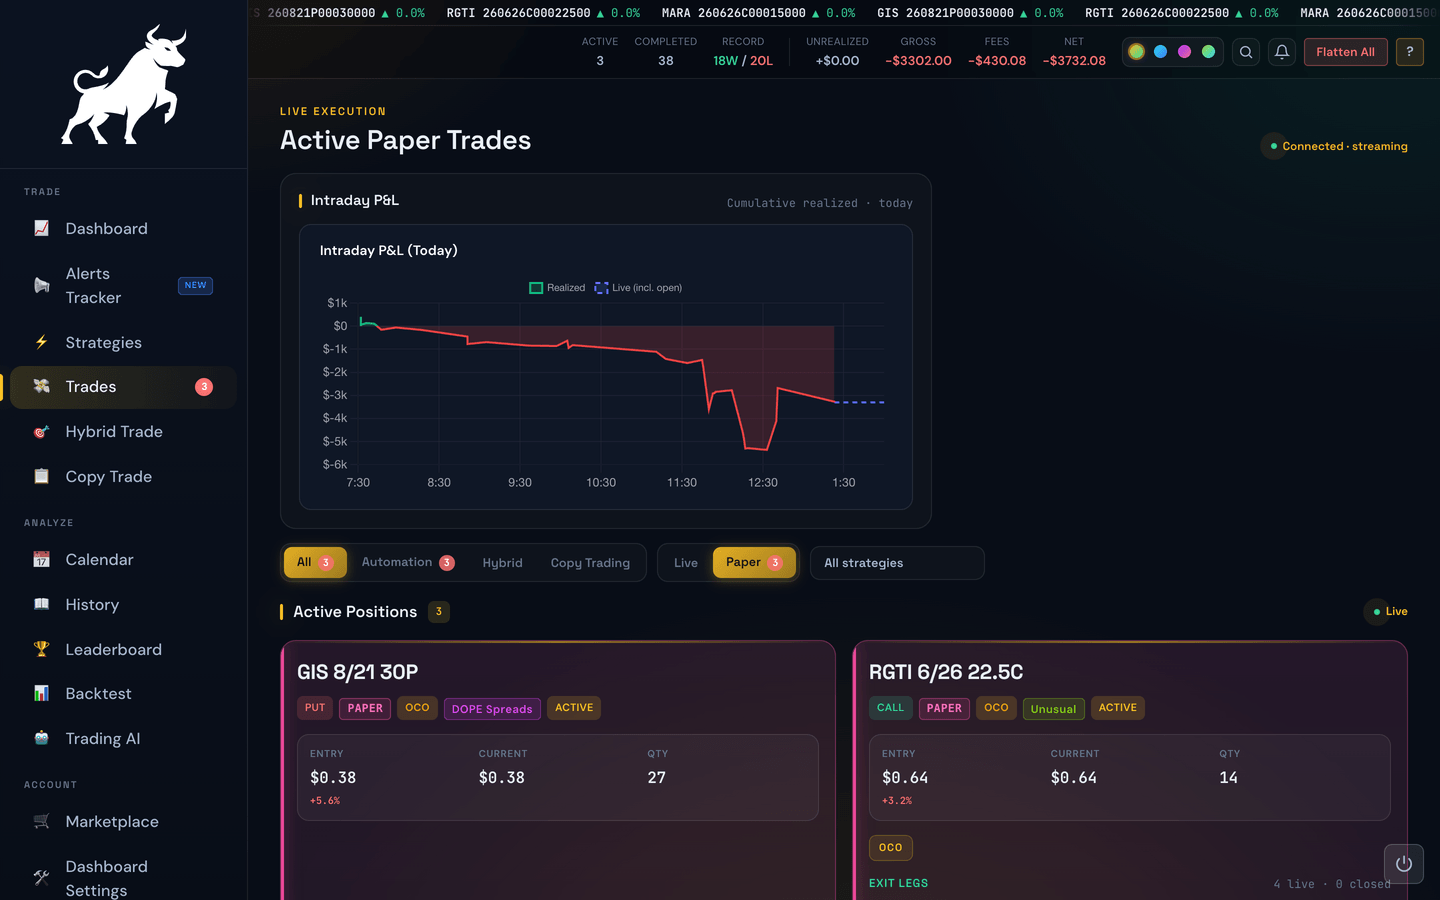
The Trades page shows every position that's open right now. Each open trade gets its own card with live, tick-by-tick updates.
What's on a trade card
A typical card tells you:
- Ticker and direction — e.g. SPY Call or QQQ Put.
- Underlying stock price (optional) — if you turn on Underlying Stock Price in Dashboard Settings, the live price of the underlying stock or ETF appears right beside the ticker (for example
SPY 12/29 747C · $611.23). It's off by default and only shows while a trade is active. - Entry price — what you paid per contract when the trade opened.
- Current price — the latest market price.
- P&L — how much that trade is up or down at this exact second.
- Profit target / stop-loss — the price levels at which the bot will close the trade.
- Trailing stop — if you use a trailing stop, the moving floor is shown alongside the highest price the trade has reached.
- Duration — how long the trade has been open.
Actions you can take
- Close — close this one trade at market price right now. The bot won't try to reopen it.
- Scale In (when available) — add more contracts to a winning trade. You can scale in at the current market price with one click, or set your own limit price.
- Modify Stop-Loss (when available) — click the stop price to edit it without restarting the trade.
Tip
Closing a single trade is different from Flatten All. Closing one trade leaves your other open trades running. Flatten All closes every trade at once.
Filtering what you see
The Trades page shows today's activity — both positions that are open right now and trades that have already closed today. A few filters at the top let you narrow it down:
- Source — All, Automation (trades the bot opened from an alert), Hybrid (trades you entered by hand), and Copy Trading (when available on your account).
- Live / Paper — when this is available on your account, switch between real-money and paper trades.
- Strategy — a dropdown to show only one strategy's trades. It appears once you have trades from more than one strategy today.
The strategy dropdown only lists strategies that actually have trades under the source and Live/Paper filters you've selected — so picking one never drops you on an empty page. For example, if you switch to Paper and your only paper trade today came from your 0DTE SPY strategy, that's the single strategy you'll see in the list. If you then change a filter in a way that hides the strategy you'd picked, the page falls back to All strategies automatically.
Card view vs. List view
At the right of the filter bar is a Cards / List toggle that changes how your trades are laid out. The information and the controls are exactly the same either way — pick whichever reads better for you.
- Cards (the default) gives each trade a full card with its prices, trailing visualization, and buttons all on display. Best when you're watching just a few positions.
- List puts each trade on a single compact row — ticker, entry, current price, P&L, stop, target, and status lined up in columns like a table — so you can scan a lot of trades at a glance. Both your Active Positions and Completed Today sections switch to the list layout together.
In List view the controls are tucked away until you need them: tap any row and it expands into a drawer with the full trade card — the same Close, Scale In, Modify SL / TP, and everything else you get in card view. Tap the row again to collapse it, and you can keep several rows open at once.
The app remembers which view you picked on this device (separately from the Copy Trade page), so if you prefer List it'll still be List next time. On a phone the rows stack neatly with a label on each value, so there's never any sideways scrolling.
Example
You've got a dozen positions open and want to find the one nearest its stop. Switch to List, scan the Stop and Price columns, tap the trade that's closest, and adjust its stop right in the drawer — without hunting through a wall of cards.
Connection status
A small indicator on the page tells you whether the portal is connected to your trading service. Green means everything's live. If you see "Reconnecting…", the portal is reattaching its live feed — usually it sorts itself out in a few seconds.
Killswitch progress
If you've set a daily profit or loss killswitch, the page shows a progress bar toward your threshold. For example, if your daily loss killswitch is -$300 and you're currently at -$210, the bar will be about 70% full toward "stop opening new trades."
When the page is empty
An empty Trades page just means no positions are open right now. New trades will appear here automatically the instant the bot opens one.
Modifying stop-loss and take-profit in place
Every trade card has Modify SL and Modify TP buttons. Click either one, type the new price, and confirm — the change is sent to the broker immediately and you don't have to close and reopen the trade. For iron condors and iron butterflies the card first asks whether you want to modify the call bracket or the put bracket. For multi-leg singles it asks which leg to modify. The portal also bundles changes you make in quick succession into a single update so the bracket doesn't flicker between states. See the Modifying Stop-Loss & Take-Profit topic for more.
Multi-leg trade cards
If the trade is a spread, the card uses the same conventions as single-leg cards but adds a few things:
- A spread-type pill next to the ticker (CC, CD, IC, IB, etc.) that names the structure.
- An expand/collapse affordance: click the spread pill (or the AVG pill, if present) to reveal each leg's strike, action, and fill price.
- A smarter Close button. For trades with two brackets (iron condors, iron butterflies), Close opens into three choices: Whole Spread, Close Call Side, or Close Put Side.
The Spread Trades topic has the full rundown of what spread pills mean and how to read the leg breakdown.
The AVG pill (averaged entries)
If you (or the bot) added contracts to an already-open trade, you'll see a small AVG pill next to the ticker. The entry price shown on the card is the weighted average across every fill. Click the pill to see the individual fills with their prices and quantities.

Scaling in at a limit price
The Scale In button is a split button. The default action sends the additional contracts at market — one click and they fill at the current price. The dropdown beside it lets you instead enter a limit price: type the net price you're willing to pay (or receive, for credits) and submit. The bot waits for the market to come to your number before adding to the position. Scale-in works on both single-leg and spread trades.

A note on the trailing visualization
When a trade is running on a trailing stop, the card shows you the floor of the trail right alongside the peak price the trade has reached so far. If your strategy uses multi-tier trailing, you'll see a vertical ladder of tiers on the card instead — each tier lights up as the trade clears it. See the Multi-Tier Trailing topic for what the ladder means.