
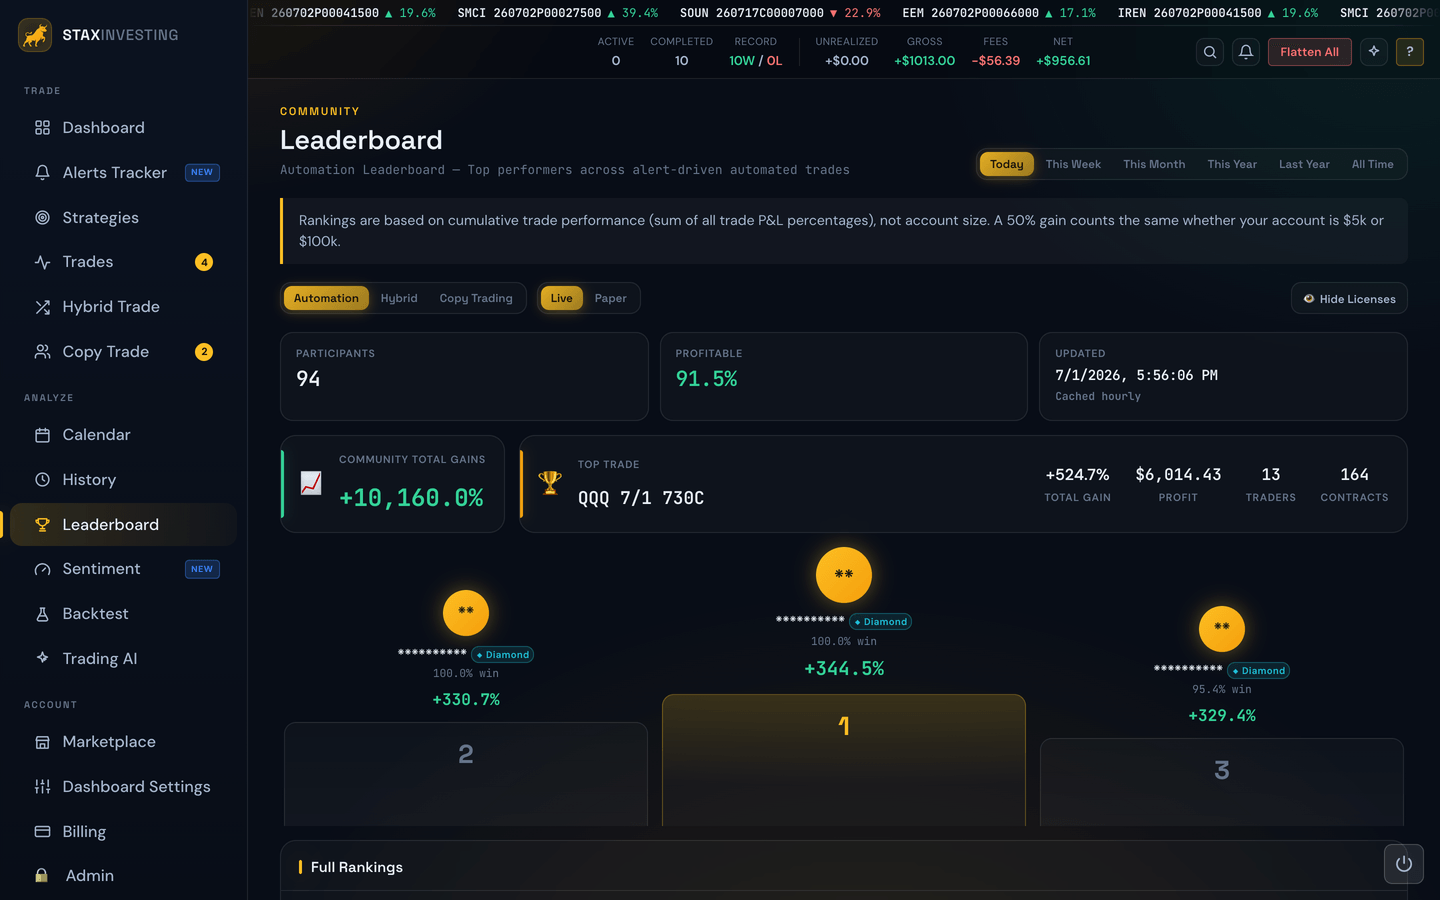
The Leaderboard ranks users by cumulative performance over a chosen period. It's a way to see how your account is doing relative to the wider community of users running the same alert sources.
Choosing a period
A row of tabs (or buttons) lets you switch the period:
- Today — just today's performance.
- 7-Day / Week — the last seven trading days.
- 30-Day / Month — the last month.
- Year-to-date / Last Year — calendar-year views.
- All-Time — every closed trade since the account started.
Choosing a source
If you subscribe to multiple alert sources, you can filter the leaderboard to one source at a time so you're comparing apples to apples — e.g. "ranking only on the SPY day-trade alerts."
Sorting
Click any column header to re-sort. Common columns include profit percentage, profit in dollars, total fees, net profit, and win rate.
The podium
The top three accounts for the chosen period are highlighted on a podium above the table — second place on the left, first in the center (raised highest), and third on the right — so the leaders stand out before you even read the table.
Tier badges
Every ranked row carries a small tier badge based on its standing: Diamond (top 5), Platinum (6–15), Gold (16–50), Silver (51–150), and Bronze below that. It's a quick shorthand for how high up the board a row sits.
Copiers
On boards where the data is available, a Copiers column shows how many people are copying that strategy. Like every other column it's sortable, so you can rank by popularity as well as by performance.
Totals row
Pinned to the very bottom of the table is a totals row that sums up the whole board for the filters you've applied. The dollar and count columns — Gross P&L, Fees, Net P&L, Trades, and Copiers — are added together, while the percentage columns (Total % Gain and Win Rate) show the average across the ranked accounts, labeled avg (adding up percentages wouldn't tell you anything useful). It recalculates on the fly whenever you change the period, source, or any other filter, so it always matches exactly what's on screen.
Who appears on the board
The leaderboard ranks active members only — anyone with a current subscription, plus lifetime members (who never lapse). If someone cancels, they stay on the board through the end of the period they've already paid for, then drop off once that period ends — so the rankings always reflect the community that's trading alongside you right now, not accounts that left months ago.
Dropping off the board only affects the ranking. Your own trades are always kept and still counted in your personal stats and history — nothing about your records changes.
For example, a trader who had a huge all-time run but cancelled last quarter won't sit at the top of the All-Time board anymore — you're always being compared against people who are still in it with you. A lifetime member, on the other hand, is always included.
What's NOT shown
The leaderboard never shows other users' usernames, license details, or anything personally identifying. You can see how everyone is doing in aggregate, but you can't tie a row back to a specific person.
Tip
The leaderboard is the easiest way to sanity-check your own settings. If the median user is up 8% this month on the same alert source you subscribe to and you're down 3%, your settings — not the alerts — are probably the issue. Time to backtest.