
The Dashboard is your at-a-glance scoreboard. Think of it as the front page of a sports broadcast: at any moment you can tell how you're doing today, this week, this month, this year, or all-time.
The time-period filter
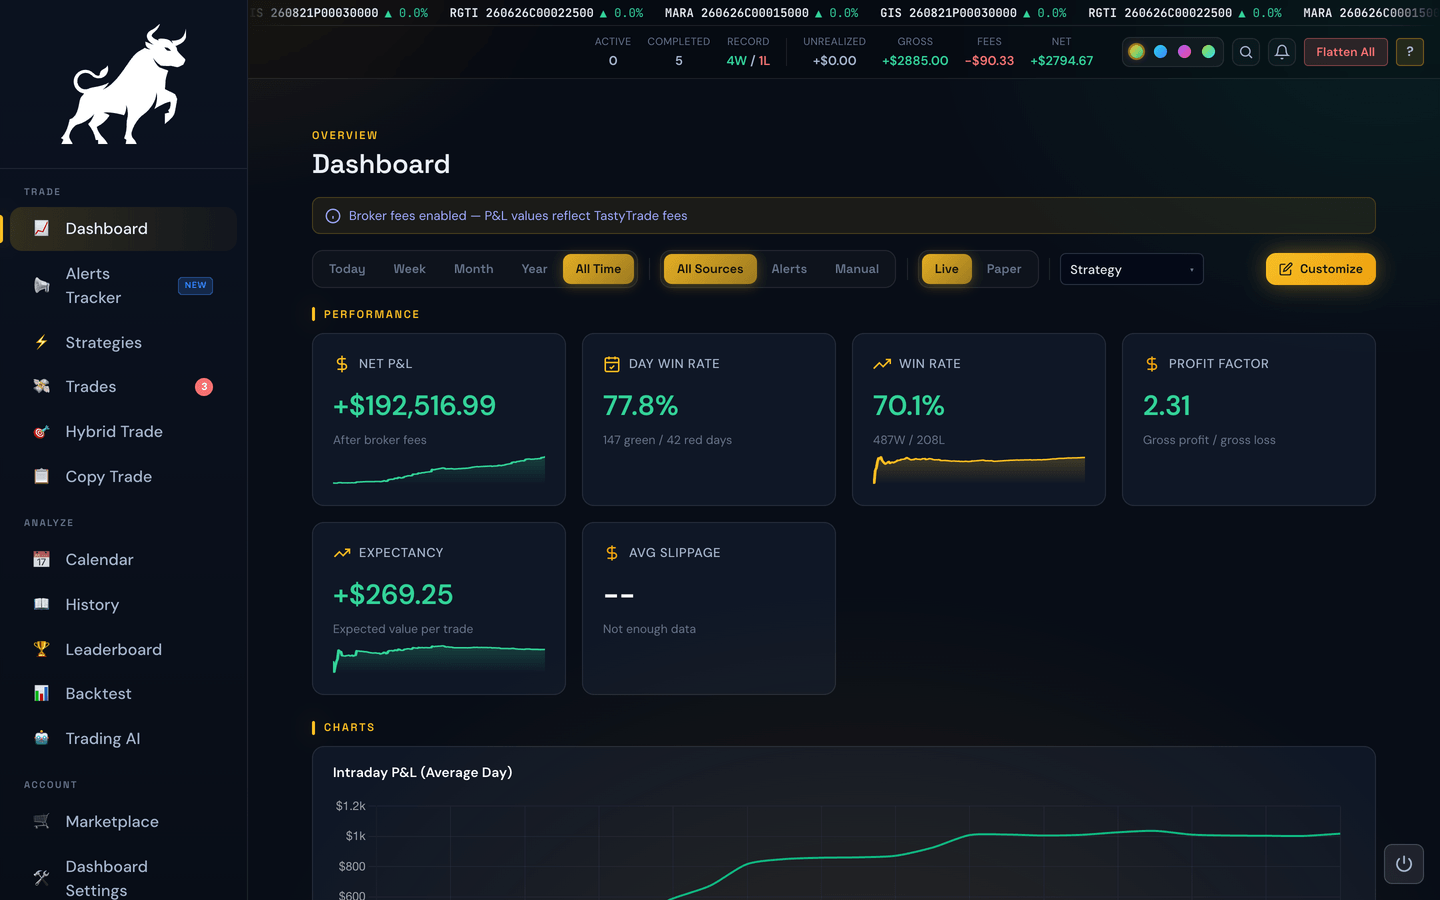
Near the top you'll find buttons or a dropdown for Today, Week, Month, Year, and All Time. Every number, every chart, every breakdown on the page recalculates instantly when you change this filter.
Example
If you click Month, the dashboard now shows trades from the first of this month through today.
The cards
The grid below is made up of cards. Each card answers one question. Examples of what you might see:
- Net P&L — your total profit after fees.
- Win Rate — the percentage of trades that turned a profit.
- Profit Factor — how many dollars you made for every dollar you lost.
- Expectancy — your average profit per trade, across wins and losses combined.
- Max Drawdown — the deepest dip in your running profit total.
- Average Win / Average Loss — the typical size of a winning trade and a losing trade.
- Total Won / Total Lost — the dollars added by all your winners and given back by all your losers.
- Best Trade / Worst Trade — your biggest single win and biggest single loss.
- Win Streak / Loss Streak — your longest runs of wins and losses.
- Daily P&L Chart — a green-and-red bar per trading day.
- Cumulative P&L Chart — your equity curve over the chosen period.
- Intraday P&L (Today) — today's profit as it builds through the session. The line and its shading sit green above the $0 mark and red below it, so a morning dip that later recovers is plainly red-then-green rather than one misleading color. This same chart also appears on the Live Trades page.
Mini trend lines
Several of the number cards — Net P&L, Gross P&L, Total Won, Total Lost, Win Rate, and Expectancy — show a small trend line (a sparkline) tucked under the value. It's a quick picture of how that metric moved across the days in your selected period: rising, falling, or flat. The line needs at least two trading days of data in the current filter to appear, so a fresh Today view may not show one yet.
Customizing your view
You can rearrange, add, or hide cards so the dashboard shows exactly what you care about.
- Click the Customize (or Edit) button.
- Drag cards to reorder them, click an X to remove one, or click Add Card to pick a new one from the menu.
- While you're in edit mode you'll also see a Default time period dropdown — pick which time-period button (Today / Week / Month / Year / All Time) should be selected the next time you open the dashboard.
- Click Done when you like what you see.
Your custom layout — including the default time period — is remembered the next time you sign in.
Breakdown tables
Some cards are tables instead of single numbers. They split your performance by:
- Ticker — how you did on SPY versus QQQ versus everything else.
- Direction — calls versus puts.
- Exit type — trades that hit your profit target versus trades that hit your stop versus trades closed by time.
Use them to answer questions like, "Am I better with calls or with puts this month?"
The source filter
Right next to the time-period filter is a source filter: All Sources, Dope Spreads, Signal-Hub. Pick one and every number, chart, and breakdown on the page narrows to just that source. It pairs with the time-period filter, so you can ask, "How did Signal-Hub do this month?" with two clicks.
Example
Time-period set to Year and source filter set to Dope Spreads — the dashboard now shows year-to-date numbers for that source only, ignoring everything else.
Filtering by strategy
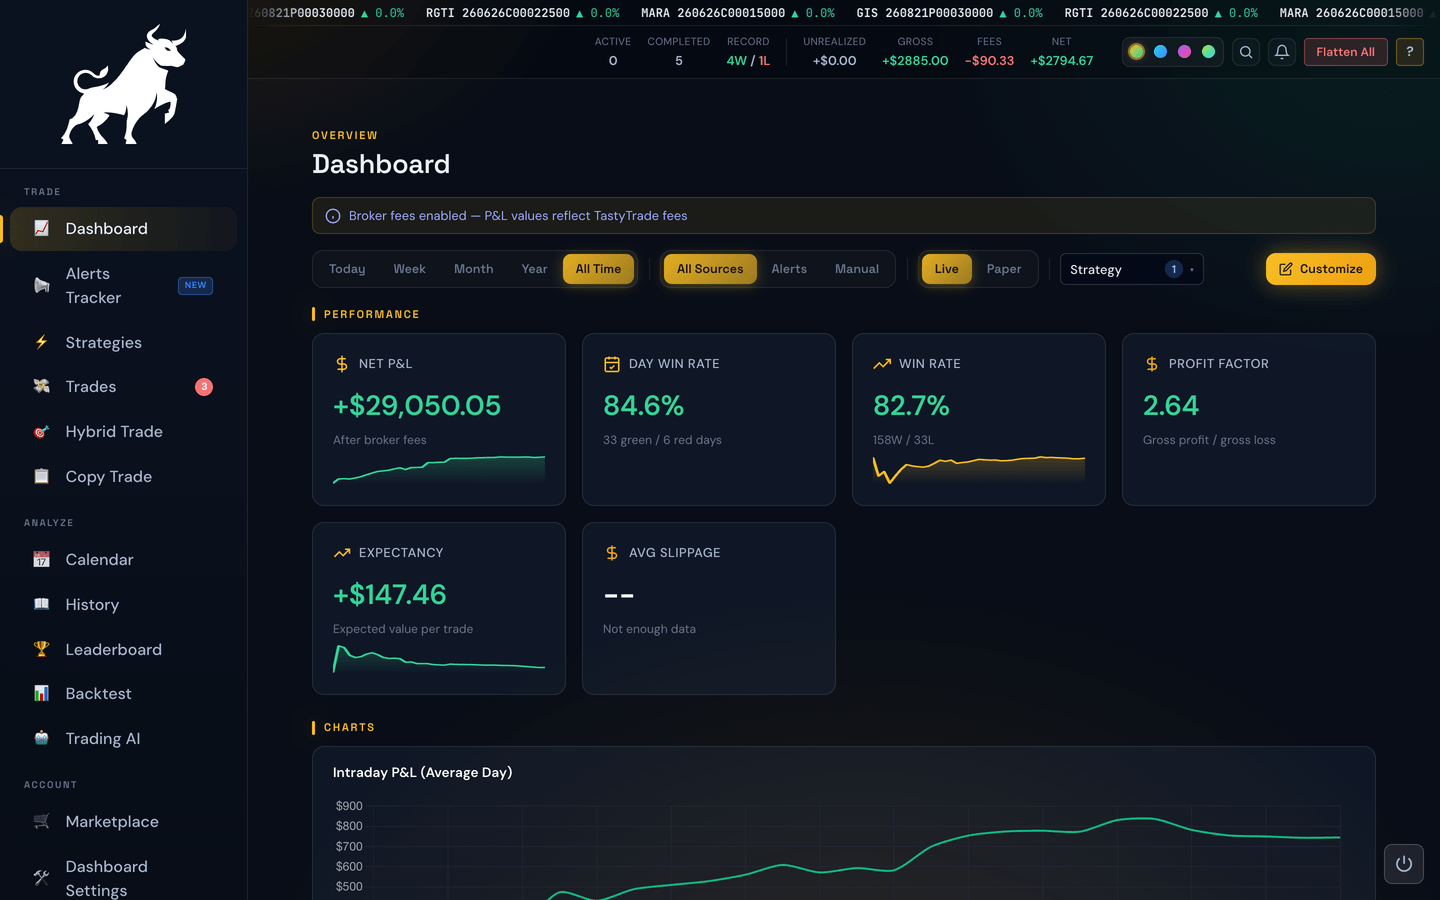
If you run more than one strategy, a Strategy dropdown appears in the filter row. Open it and tick one or more strategies to narrow the entire dashboard — every card, every chart, every breakdown table, the Active Trades cards, and the Recent Trades list — down to just those strategies. Leave nothing ticked to see them all combined, the way the dashboard normally opens.
Each strategy is listed with its own colored dot — the same color used on that strategy's pill everywhere else in the portal — so the one you want is easy to spot. The little number on the dropdown button tells you how many you've picked, and Clear inside the dropdown resets your choice.
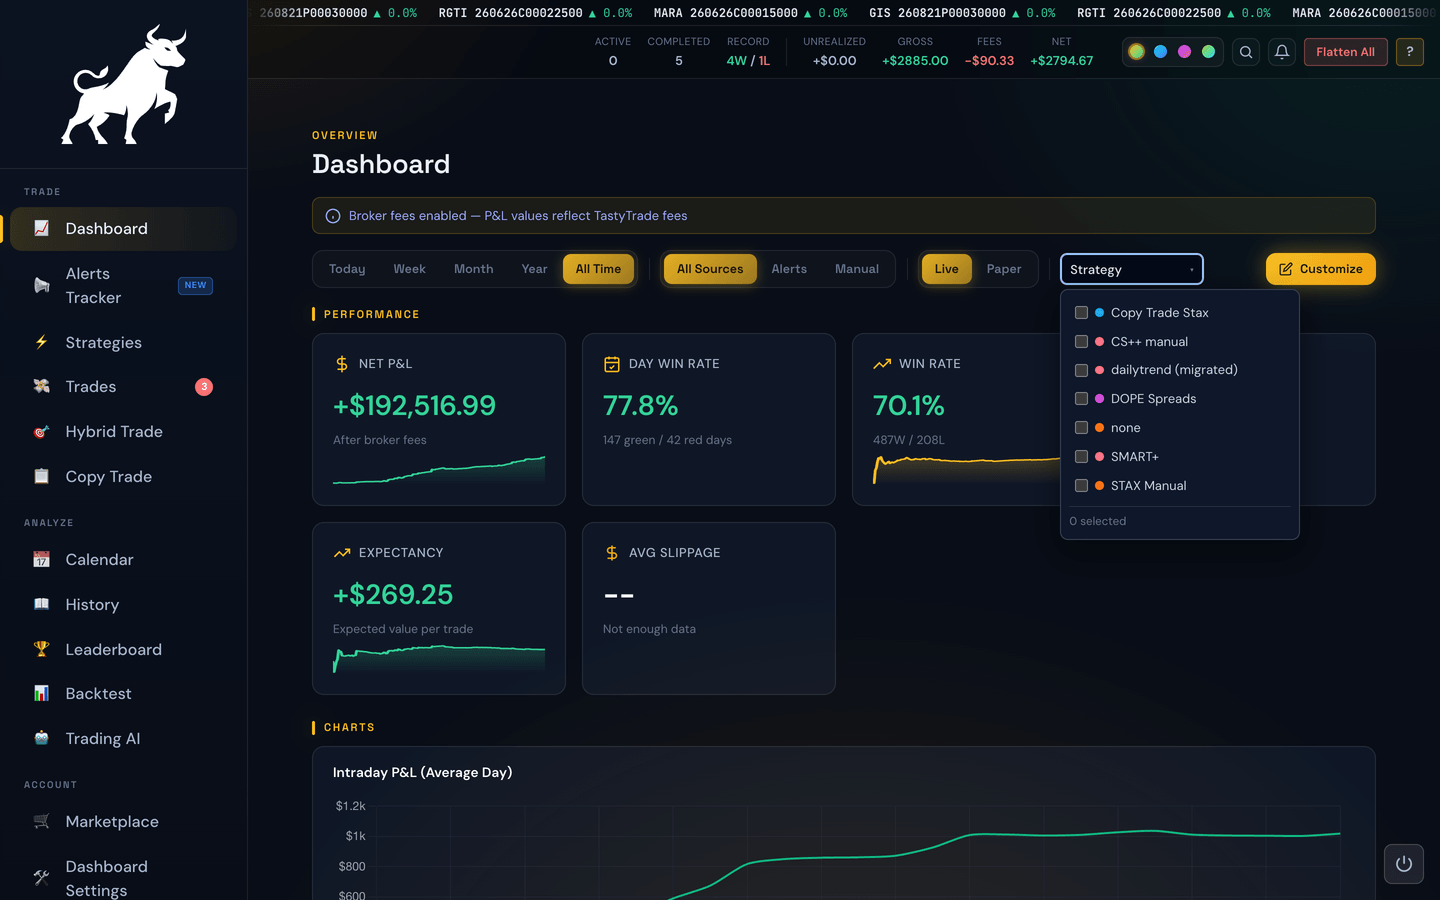
The strategy picker stacks with the time-period, source, and Live/Paper filters, so you can ask very specific questions with a few clicks. The dropdown only lists strategies that actually have trades under the other filters you've set — so if you switch to Paper for Today, you'll only see strategies that traded on paper today, never an option that would leave the dashboard blank. If a filter change hides a strategy you'd already ticked, it's dropped from your selection automatically.
Example
Tick Daily Trend and OG, then set the time period to Month — the dashboard now shows this month's combined numbers for just those two strategies, and your other strategies drop out of every card and chart.
Banners you may see
A handful of banners can appear above the cards depending on what's going on in your account:
- Skip Day — today is a configured skip day; the banner names the reason and which strategies are paused.
- Connection status — shown when the portal has lost its live link to the trading service. Most disconnects clear themselves within a few seconds.
- Pending plan change — when you've requested a plan upgrade or downgrade and there's still an action for you to take (for example, approving a new PayPal agreement), this banner sits at the top until the change is finalized.
- Broker fees enabled — a friendly reminder that the P&L numbers across Dashboard, Calendar, and History are reflecting your broker's fee schedule. Switch it off in Dashboard Settings if you want gross numbers instead.
Active Trades on the Dashboard
If any trades are open right now, you'll see them on the Dashboard as compact cards near the bottom — same idea as the Live Trades page but folded into the overview so you don't have to switch tabs to glance at them. Each card shows ticker, quantity, entry, current price, P&L, and whatever stop / target is in play. You can close a single trade from here if the Close action is available on your account.
Recent Trades
Below Active Trades is a Recent Trades table — the last 10, 25, or 50 closed trades depending on what you pick. The columns mirror what you'd see in the History page (entry / exit, slippage, gross, net, exit reason) so you can scroll a quick "how did I do today" without leaving the dashboard.